Published on July 15, 2026 | Written by Mr. Shifa ur rehman jamali
Databricks bills spike 50–200% above forecast because of a dual-billing structure (DBUs plus separate cloud VM costs), All-Purpose clusters running production jobs at 3–4x the price of Job clusters, idle compute left running, and ungoverned storage. A structured cost audit covering compute, workload engines, storage, and FinOps governance typically recovers 30–60% of spend within one quarter.
Databricks costs more than expected because it charges twice for every workload — once in Databricks Units (DBUs) for the platform layer, and again from your cloud provider (AWS, Azure, or GCP) for the underlying compute, storage, and networking. Most teams budget for one bill and get blindsided by two.
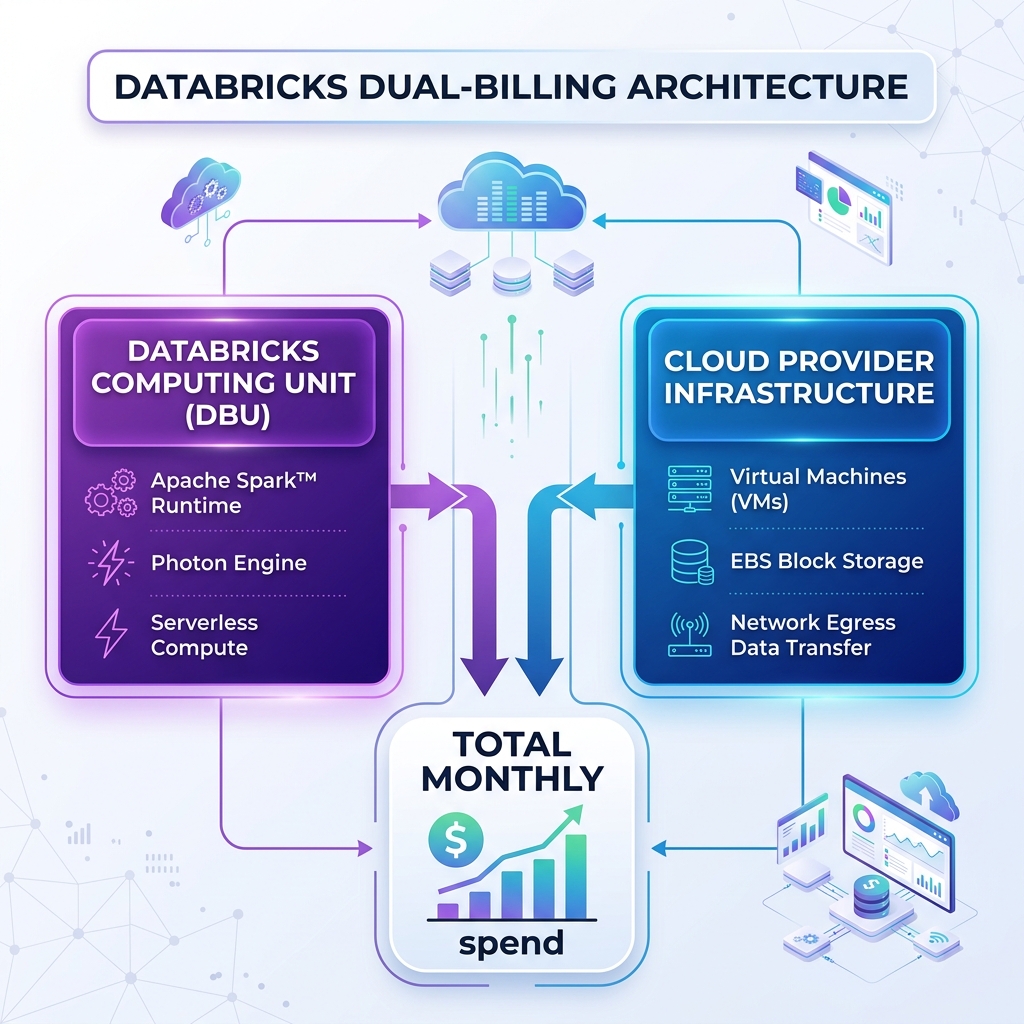
This dual-billing architecture is the single biggest source of budget confusion. A cluster doesn't just consume DBUs — it simultaneously rents EC2/Azure VM instances, attached EBS storage, and data egress, all metered independently. Compute alone accounts for 60–80% of total Databricks expenses, which means almost every cost-control lever in this framework starts with how, where, and how long clusters run.
The second driver is what's often called the "Interactive Query Tax." Databricks prices compute tiers very differently depending on cluster type:
| Compute Tier | Typical DBU Rate (AWS) | Intended Use |
|---|---|---|
| Jobs Compute | $0.07–$0.15/DBU | Scheduled, automated production pipelines |
| All-Purpose Compute | $0.40–$0.55/DBU | Interactive, collaborative notebook development |
| Serverless SQL | ~$0.22/DBU | Ad hoc BI and dashboard queries |
*(List prices vary by cloud, tier, and region — check the official Databricks pricing page and, for Azure workspaces, the Azure Databricks pricing page before budgeting.)*
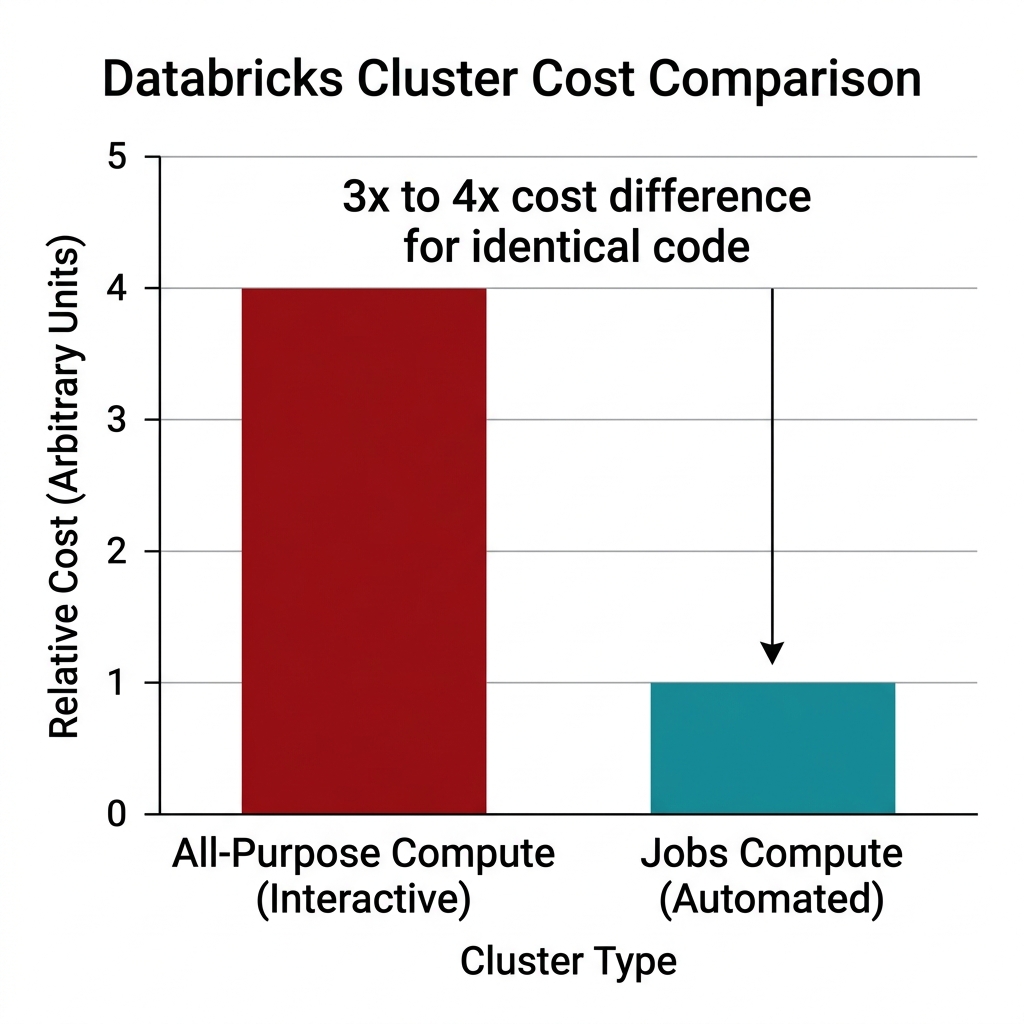
Running scheduled batch jobs on All-Purpose clusters instead of Job clusters routinely means paying 3 to 4 times more for identical compute. Combine that with idle cluster time and oversized nodes, and unoptimized environments inflate costs by 30–50% before any actual business value is added.
A comprehensive Databricks cost audit breaks down into four categories: compute and cluster configuration, workload and engine optimization, storage and data engineering practices, and FinOps governance. Each category functions as an independent checklist, and together they cover nearly every dollar in a typical bill.
Think of it as a funnel: compute configuration controls the largest share of spend, engine selection controls efficiency per hour, storage practices control how long compute needs to run at all, and governance controls whether any of the above gets enforced consistently across teams. Skipping any one category leaves savings on the table, because the categories compound — a well-tuned cluster running an inefficient engine on badly laid-out data still burns cash.
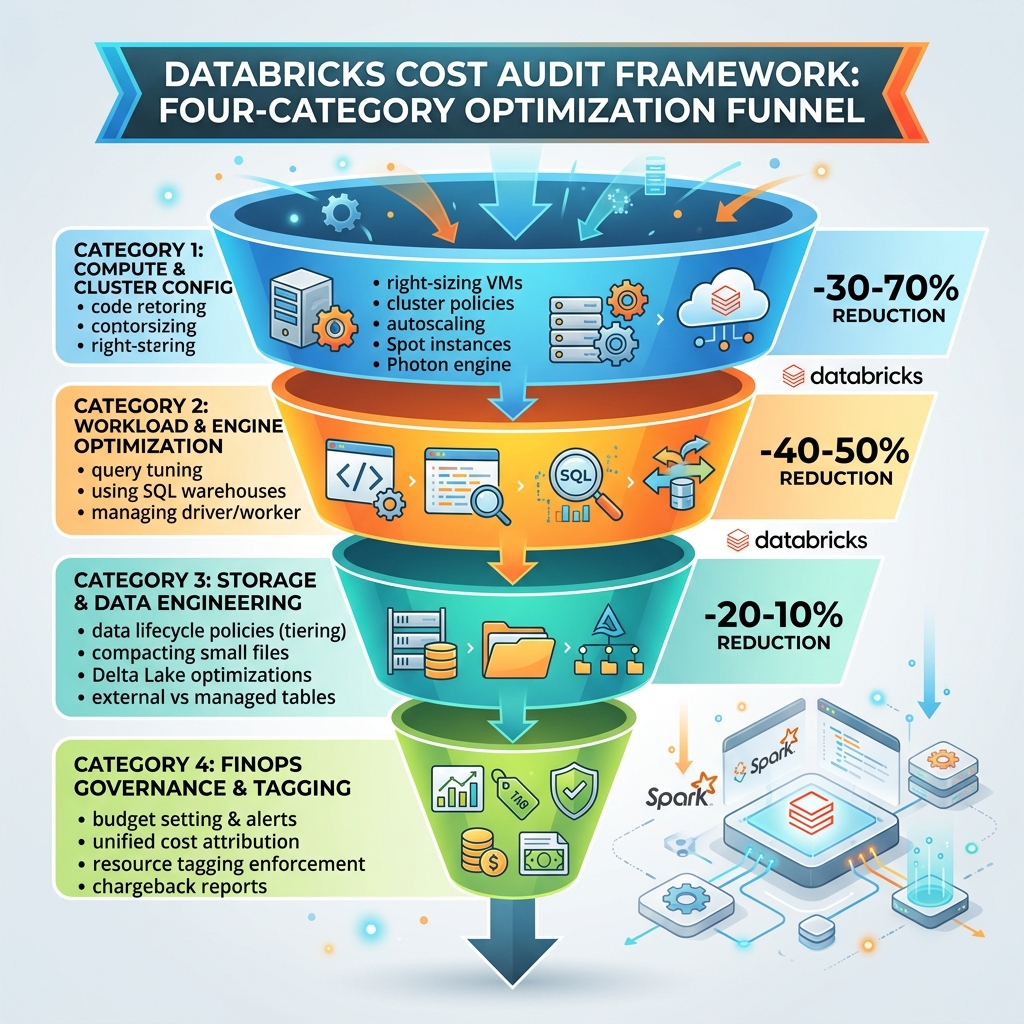
The sections below walk through each category with its own diagnostic checklist, so a platform lead or FinOps practitioner can run this directly against their workspace.
Cluster configuration is the highest-ROI area to audit first because compute drives 60–80% of total spend, and most misconfigurations here are fixable in hours, not months. The three most common leaks are cluster-type mismatches, idle auto-termination windows, and unused Spot Instance discounts.
Matching the execution engine to the actual workload prevents paying a performance premium where no performance gain exists. The clearest example is the Photon engine, which accelerates large SQL joins by 2–3x but doubles the DBU rate — a net loss on small datasets.
Photon is not a universal upgrade; it is a targeted one. According to Databricks' own documentation, Photon delivers its clearest benefit on longer-running queries over large datasets, while queries completing in under two seconds see little improvement since execution time is dominated by planning overhead rather than data processing. On smaller interactive workloads, enabling it can simply double the bill for no measurable speed benefit. The same logic applies to streaming: traditional always-on structured streaming charges DBUs every hour of every day, whether or not fresh data actually matters that often. If the business can tolerate data that's a few hours stale, switching to Databricks' AvailableNow trigger converts a 24/7 cost center into an incremental batch job.
BI workloads deserve their own scrutiny. Standard SQL Warehouses often sit idle between queries but still accrue cost; Serverless SQL Warehouses eliminate that idle penalty and scale instantly, which matters when hundreds of analysts hit dashboards throughout the day.
AvailableNow triggered batch processing?Poor data layout forces Spark to scan far more files than necessary, which directly extends how long a cluster needs to stay active — and every extra minute of runtime is billed twice, in DBUs and cloud VM time. Fixing storage hygiene shortens job duration, which shortens the bill.
Delta Lake's data-skipping capabilities routinely outperform raw Parquet, ORC, or JSON for exactly this reason — the engine can skip irrelevant files instead of scanning everything. Small-file sprawl compounds the problem: thousands of tiny files create metadata overhead that slows every query touching that table. Regular OPTIMIZE and VACUUM jobs, plus Liquid Clustering (or Z-Ordering) on high-cardinality columns, keep tables lean. (For a deep-dive on indexing configurations and clustering rules, see our comprehensive Delta Lake Optimization Guide). On top of table format, most teams are quietly overpaying for attached block storage — Databricks provisions generous default EBS volumes that go largely unused on workloads with minimal disk spillage.
OPTIMIZE and VACUUM scheduled regularly to compact small files?Cost governance fails silently when no one owns it — you cannot control spend you cannot attribute to a team, project, or workload. Cluster policies and mandatory tagging turn an ungoverned free-for-all into a system where every DBU maps back to a cost center.
Cluster policies enforce T-shirt sizing (Small/Medium/Large), cap maximum node counts, and block unauthorized GPU provisioning before it happens, rather than catching it after the invoice arrives. Mandatory tags for Business Unit, Project, and Environment — enforced and queried through the system.billing.usage system table — make spend traceable to an owner; Databricks' documentation confirms these tags propagate directly into the billing records once applied to compute resources. Beyond internal governance, some organizations are rethinking where BI workloads run at all: exposing data via Unity Catalog in Iceberg/UniForm formats lets alternative query engines like Dremio serve dashboard queries directly, without waking up Databricks compute, cutting BI-related analytics costs by an estimated 60–80% in some deployments.
system.billing.usage?Real Databricks cost audits typically produce 15–40% savings within 30 days from governance-only changes, and 40–60% savings over a longer horizon once architectural changes are implemented. The gap between the two reflects the difference between fixing behavior and fixing infrastructure.
In the quick-win phase, one organization traced 40% of its entire Databricks bill to All-Purpose clusters left running overnight with no auto-termination. Enforcing a strict 15-minute termination policy and moving scheduled ETL onto Job clusters cut the DBU burn rate for those workloads by up to 75%. Restricting GPU-optimized instances to teams actually running GPU-accelerated ML libraries closed another leak with essentially no engineering effort.
The longer architectural phase compounds those gains. In one fintech migration (comparable to patterns detailed in our Legacy Data Warehouse to Databricks Migration Playbook), pairing memory-optimized instances with heavy-shuffle workloads and applying Liquid Clustering to data layout drove a 45% total cost reduction. Organizations with heavy BI concurrency have gone further, moving dashboard traffic off Databricks SQL Warehouses entirely by serving it through Iceberg/UniForm tables in Unity Catalog — bypassing Databricks DBU charges for downstream reporting altogether.
Engine-level fixes compound with cluster-level ones. In one documented case, Raiffeisen Bank International's Sem Sinchenko described a Photon-accelerated point-in-time join that got results "reduced by more than 20 times" (Databricks Blog) — a reminder that engine selection and data-layout fixes reinforce each other rather than acting as separate levers.
A: Databricks bills DBUs for the platform layer (Spark runtime, orchestration, Photon, etc.) while your cloud provider bills separately for the VM instances, attached storage, and network egress underneath. Both charges scale with the same runtime, so they need to be audited together, not in isolation.
A: On AWS Standard/Premium tiers, Job clusters run roughly $0.07–$0.15 per DBU versus $0.40–$0.55 per DBU for All-Purpose clusters — a 3–4x premium for running the same workload on the wrong cluster type.
A: No. Photon roughly doubles the DBU rate in exchange for 2–3x speedups on large SQL joins and aggregations (typically 100GB+). On smaller datasets, it usually costs more without a meaningful performance benefit, so it should be tested per workload rather than enabled globally.
A: Shrinking auto-termination from the 120-minute default to 15–30 minutes has, in documented cases, cut DBU burn on affected clusters by up to 75%, since idle clusters bill at the full rate until they shut down.
A: Classify every active cluster by workload type and migrate any production, scheduled job still running on an All-Purpose cluster to a Job cluster. This single move typically produces the largest and fastest visible reduction in the bill.
A: They work well for fault-tolerant, restartable batch jobs, offering 60–90% discounts versus On-Demand pricing. Best practice is to keep the driver node On-Demand for stability while running worker nodes on Spot.
A: Treat it as continuous rather than a one-time exercise — usage patterns, table sizes, and team headcount shift monthly, so tagging, cluster policies, and storage maintenance jobs should be reviewed on a recurring (ideally monthly) cadence rather than only during a budget crisis.
Databricks pricing complexity isn't inherently risky — it becomes risky only in the absence of governance, visibility, and architectural hygiene. Start with workload classification: review every active cluster and migrate scheduled jobs off interactive compute. Then deploy cluster policies to standardize sizing, mandate auto-termination, and enforce FinOps tagging. Finally, audit data layout and BI access to confirm tables are optimized and that high-concurrency dashboards aren't unnecessarily spinning up expensive compute. Treat cost optimization as a continuous engineering practice, not a quarterly cleanup.
Our independent consultants conduct end-to-end workload audits to identify compute and storage waste. We help teams reclaim 30-60% of their DBU budget.
Request a Workload AssessmentNote: the framework structure and several worked cost-savings examples in this piece are drawn from an internal audit research brief; figures on DBU rates and cluster behavior have been cross-checked against the official Databricks and Microsoft pricing/documentation pages linked above. Pricing changes frequently — verify current rates before budgeting or publishing.